
Graphs Are Everywhere
1736 to the Present Day
Graph databases originate from graph theory, a concept created in 1730's Prussia.
The Seven Bridges of Königsberg problem asked whether it was possible to walk through the city, crossing each of its seven bridges exactly once without retracing steps.
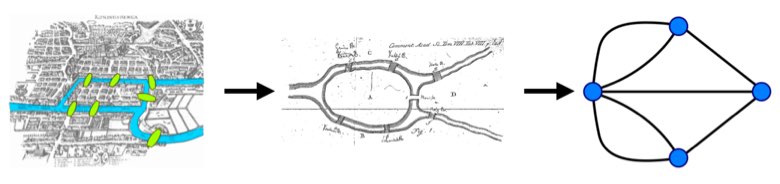
Euler solved this by representing the landmasses as vertices (nodes) and the bridges as edges (relationships), forming a graph.
He proved that such a path was impossible because the graph required all nodes to have an even number of edges, which was not the case, thus laying the foundation for graph theory.
Graphs allow you to find new information and prove hypothesis.
Customer Recommendations
Customer data forms a natural graph: customers purchase products, rate them, and belong to segments. Traversing these relationships reveals patterns that drive personalized recommendations.
Alice and Bob both purchased the Sports Watch. Bob also purchased a Yoga Mat. A graph query can traverse this pattern and recommend the Yoga Mat to Alice —a customer who bought a similar product also bought this.
Network and Security
IT infrastructure maps directly to a graph: devices connect to servers, users access devices, and software runs on hosts. Analyzing these relationships reveals suspicious access patterns and potential vulnerabilities.
A single user logged into multiple devices, each connecting to critical servers. Graph queries can flag anomalous access patterns —like a user connecting from two locations simultaneously or accessing servers outside their usual scope.
Fraud Detection
Financial transaction data reveals circular patterns that signal fraud. When money flows from Account A to B to C and back to A, that cycle is nearly impossible to detect in rows and columns —but obvious in a graph.
Each transfer loses a small amount —the cost of laundering. A graph database can detect these cycles in real time, across millions of transactions, by following the chain of TRANSFERRED relationships.
Supply Chain
Supply chain data tracks which suppliers provide parts, which parts go into products, and which warehouses stock them. A graph captures these multi-layered dependencies.
If Acme Steel faces a disruption, a graph query instantly identifies every product affected and every alternative supplier —something that would require multiple complex joins across separate tables in a relational database.
Knowledge Graphs and Generative AI
Graphs have become an important part of developing Generative AI (GenAI) applications. GenAI applications need access to the meaning in data, and knowledge graphs provide this context.
An AI agent that remembers context across conversations needs three types of memory, and all three are naturally represented as graphs stored in the same database:
- 1
Short-term memory —a chain of messages within a conversation, accessed sequentially or by vector search.
- 2
Long-term memory —a knowledge graph of entities and relationships, persisted across sessions. This is the layer that remembers facts, people, and context.
- 3
Reasoning memory —an audit trail of how the agent reached its conclusions, linking reasoning steps back to tool calls and retrieved entities.
Because all three layers live in the same graph database, a single query can traverse from a tool call to the reasoning step that invoked it, to the message that triggered it, to the entity it referenced.
You can explore this architecture in depth in the Building Context Graphs for GenAI course.
Neo4j and generative AI combine vector search, knowledge graphs, and data science to build more accurate AI applications.
You can read more about Neo4j industry and customer use cases.
Check your understanding
Sign in to test your knowledge with interactive questions, track your progress, and earn a certificate when you complete the course.
Sign in or register